How to view High Speed Data
To view and to perform analysis on High Speed Data, it is necessary to use the Analysis App.
Contrary to what you might assume, it isn't a requirement to have an internet connection to view data using the Analysis App. It is only necessary to have an internet connection to load the page initially. Once it is loaded (and as long as you don't close the tab/window), you can continue to view as many files as you wish.
The following steps will guide you through the process of uploading, viewing and analyzing High Speed Data.
Step 1
Go to our Analysis App.
Drag-and-drop the High Speed Data file(s) (.dat) anywhere onto the Analysis App web page (except the navigation drawer on the left-hand side of the page).
Note: You can drag-and-drop files individually (one after the other) or drag-and-drop multiple files at once.
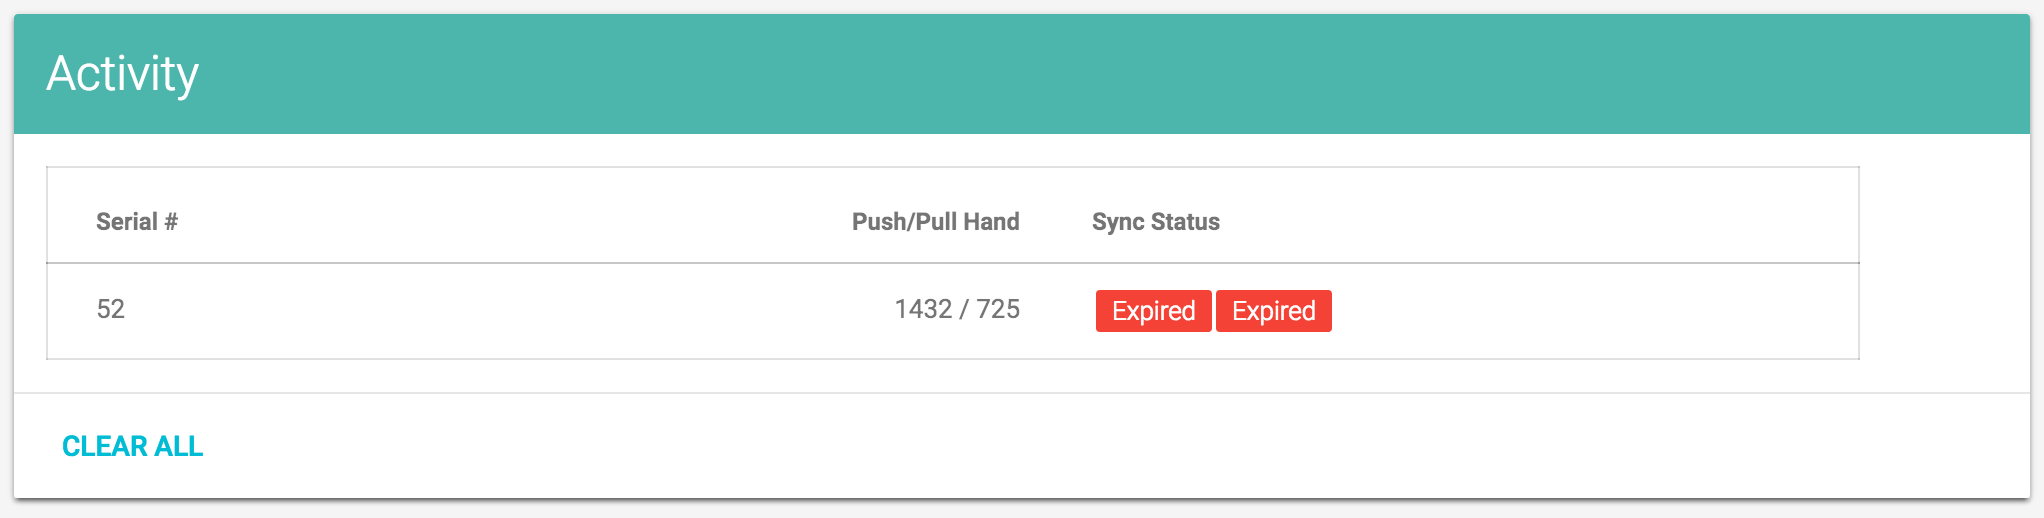
- For every High Speed Data file you drag-and-drop, the power meter on which it was recorded is identified and will be listed in the 'Activity Table'.
Step 2
- The 'Main Chart' is shown below.
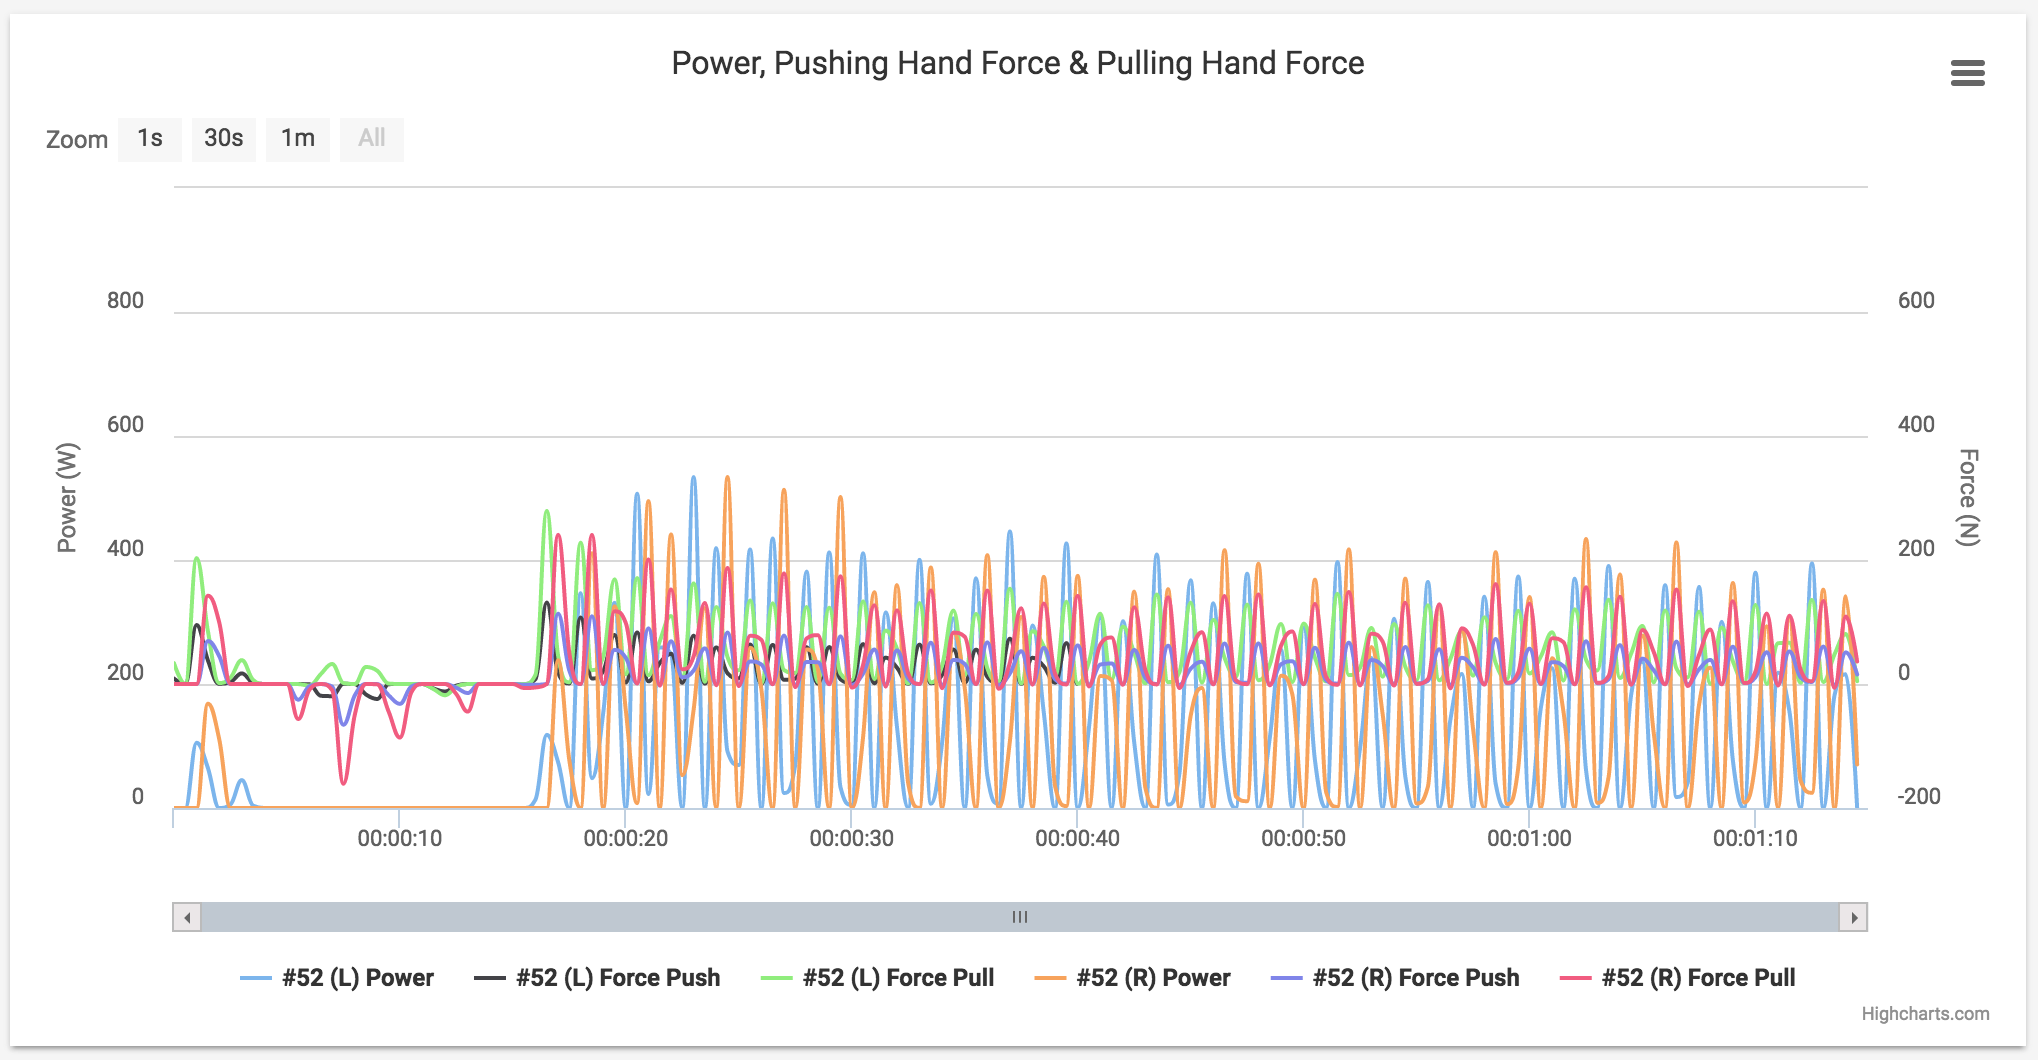
Zoom-in on the specific section of data you wish to perform analysis. To zoom, simply click and drag your mouse across the x-axis and an area of the chart will progressively become highlighted - starting at the location where you first clicked. Let go of the mouse button when you have highlighted the section you wish to zoom in on.
Once you are satisfied with the section of data which is currently in view on the 'Main Chart', simply click anywhere on the background of the 'Main Chart' to update all of the charts below.